SID screenshots
The following screenshots are part of a demonstration given at the
Embedded Systems Conference in
2001. They are snapshots of a more in-depth demonstration of SID's
capabilities for debugging and profiling embedded software. Note that
these images are quite large (approximately 200KB each).
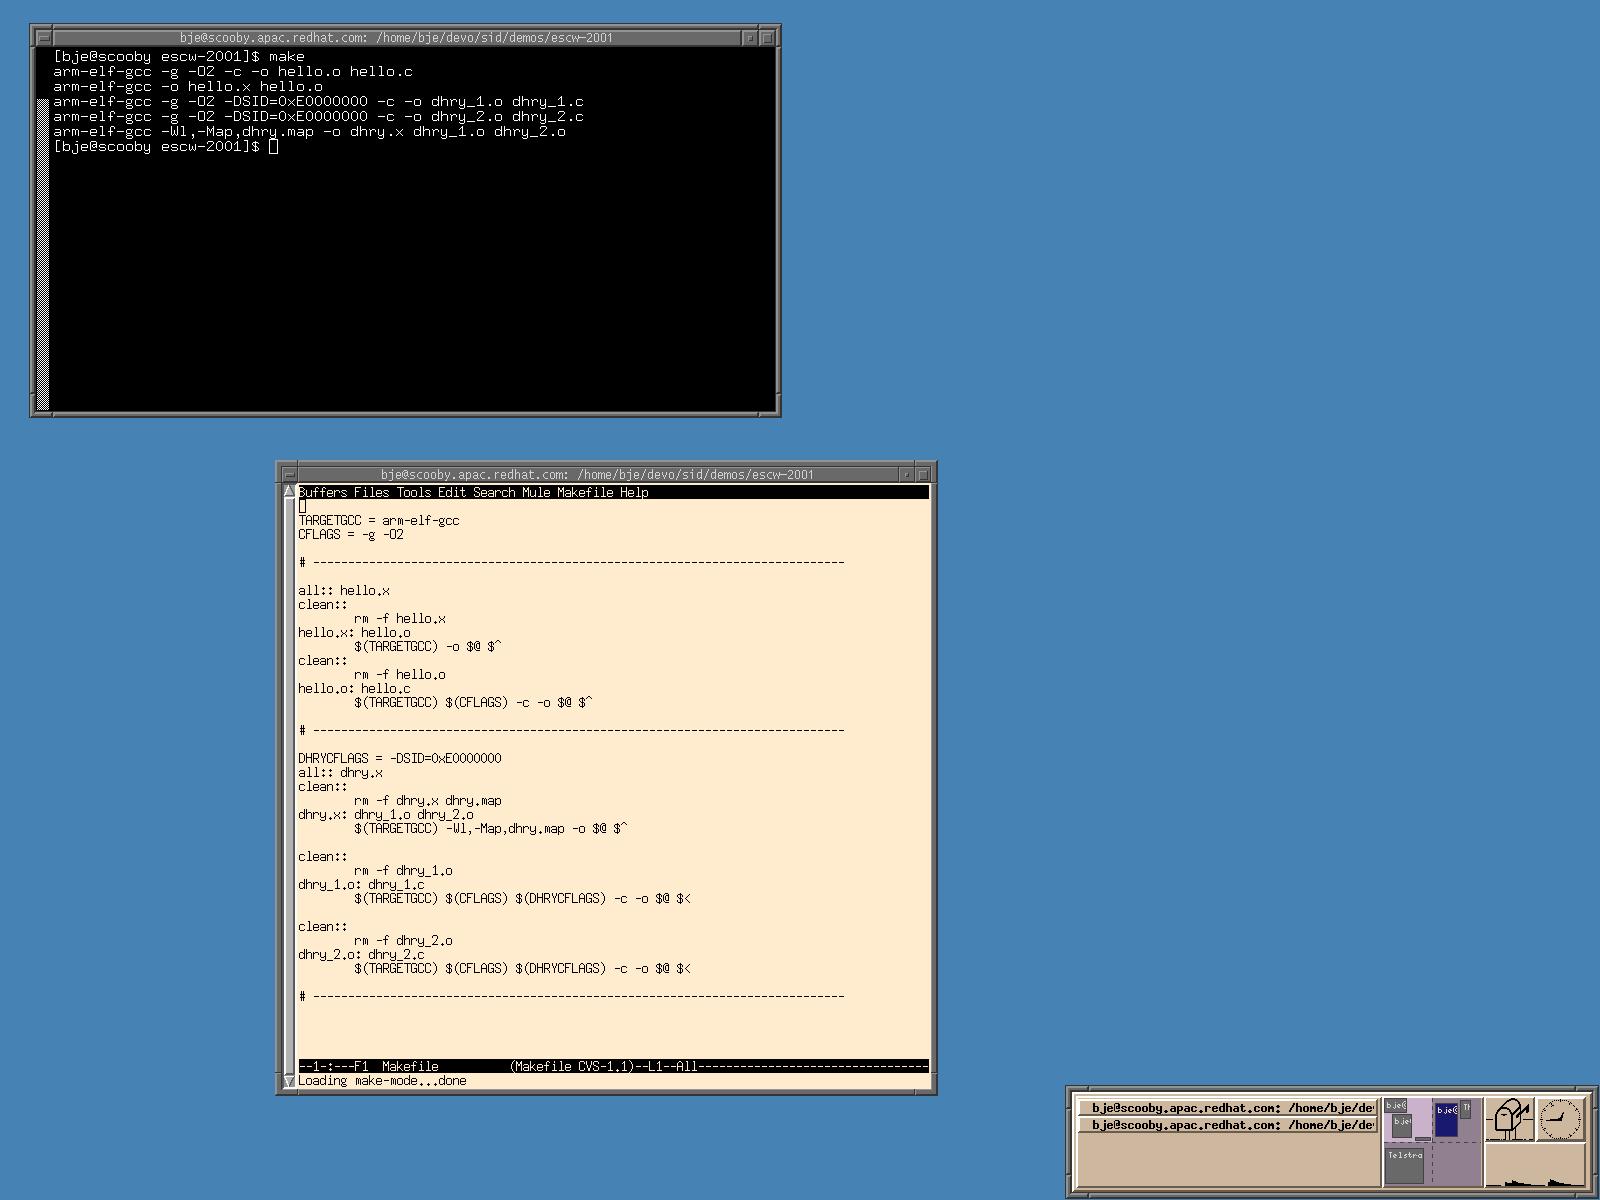
- This screen shot shows make processing a simple Makefile to build
two ARM programs that will be the basis for study: the canonical
"Hello world" (hello.x) and the Dhrystone benchmark
(dhry.x).
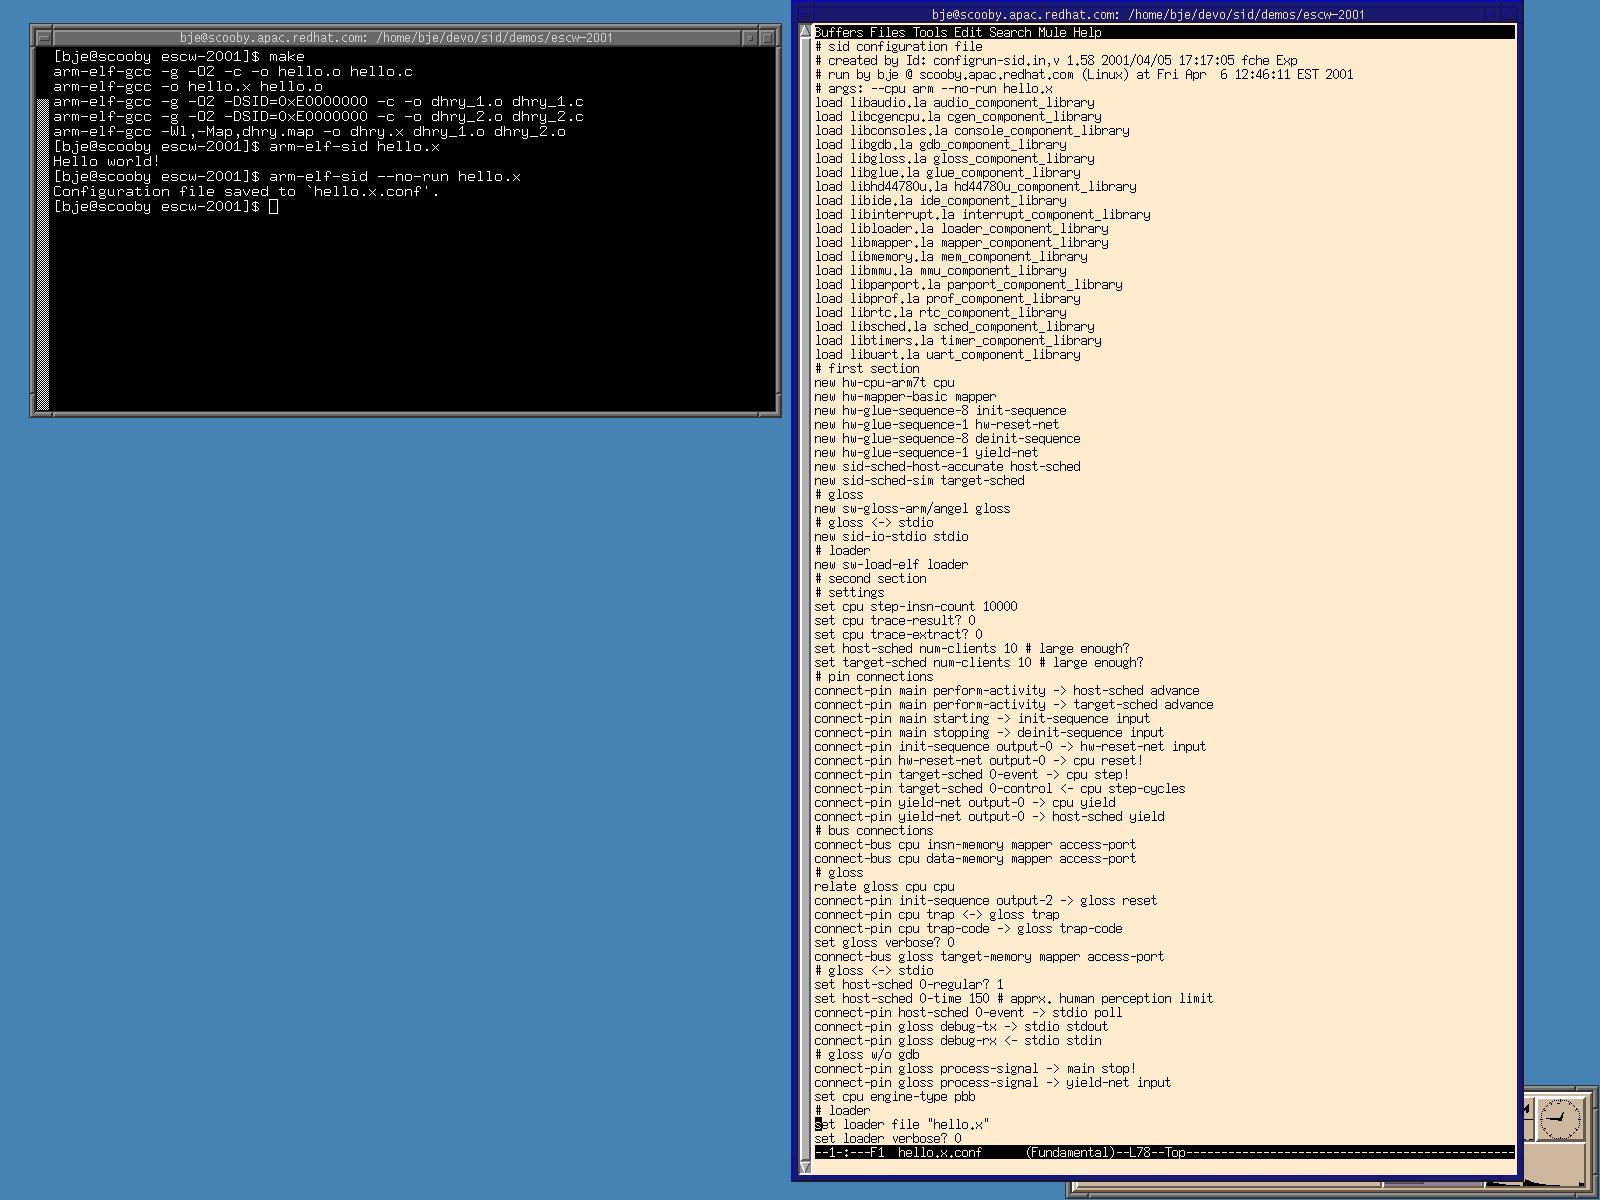
- This screen shot shows the easiest way to invoke SID for well-known target
configurations. In the case of the ARM7T, arm-elf-sid can be
used to run a program stand-alone. The arm-elf-sid program
accepts a --no-run option, which writes out the SID
configuration file needed to run the simulation and then stops. The
configuration file is shown in the window to the right.
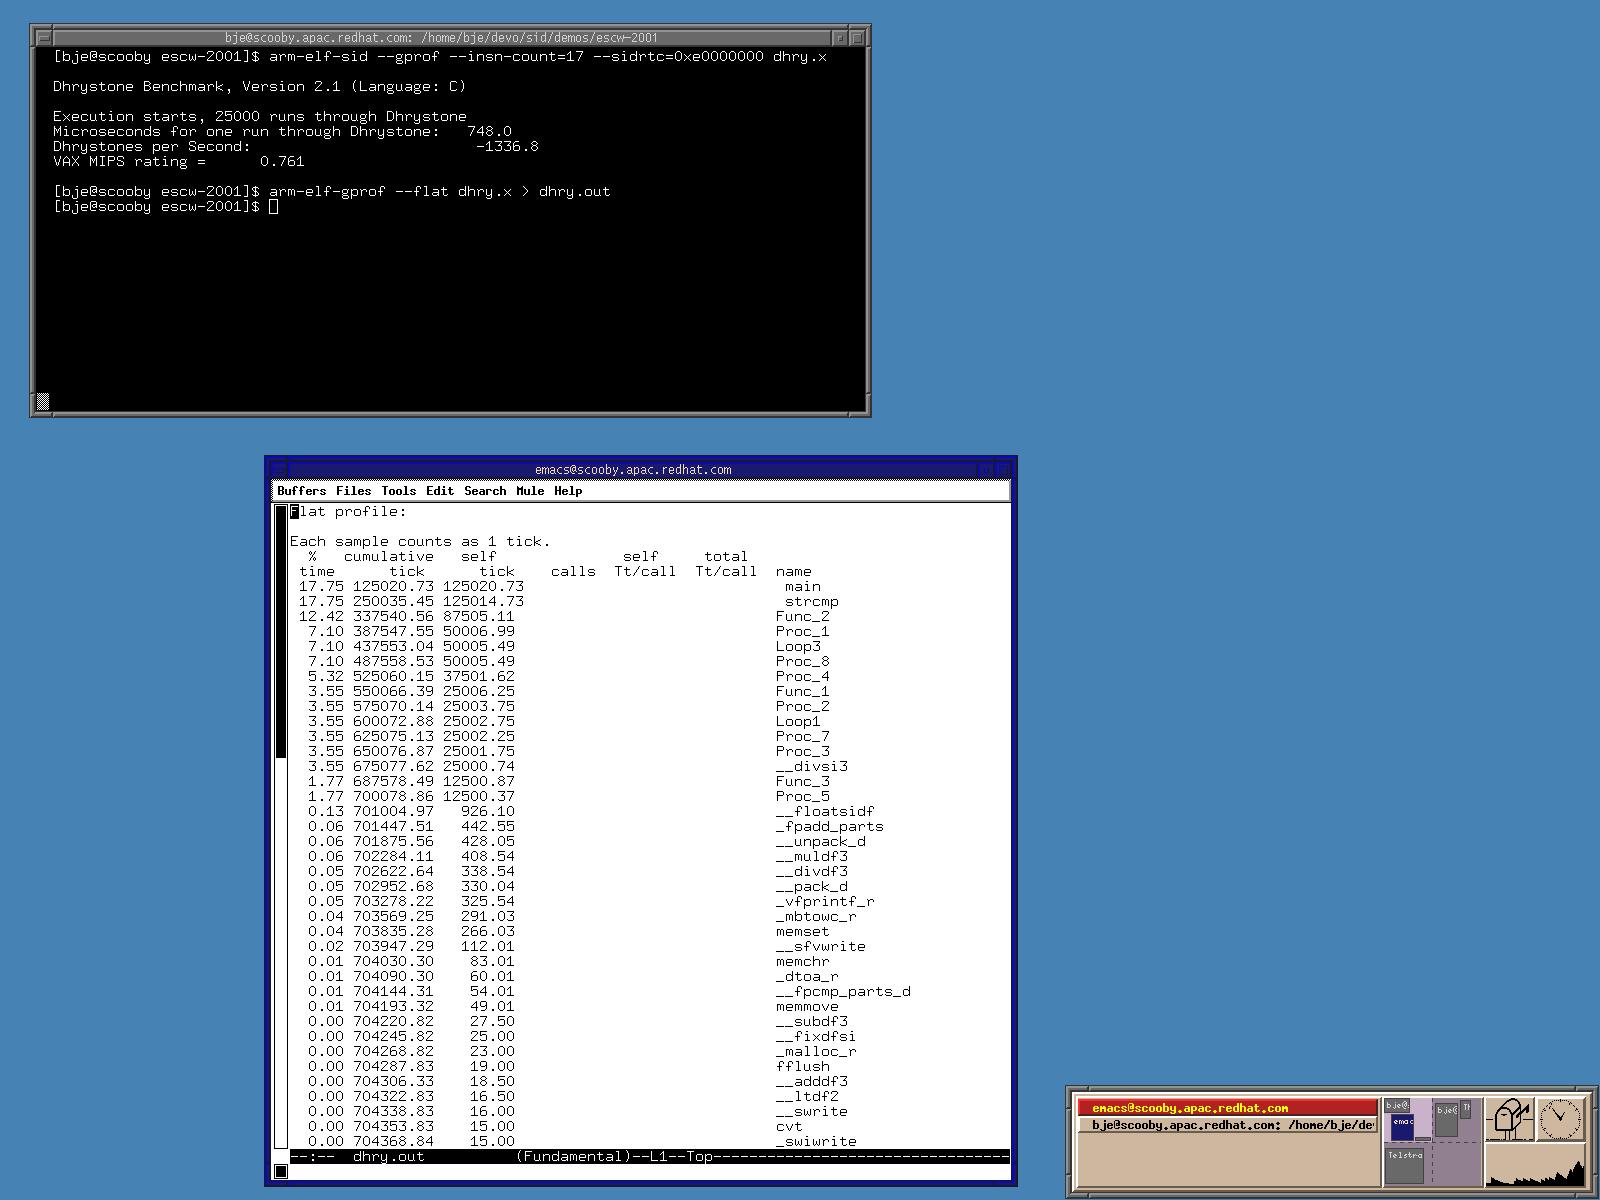
- This screen shot shows arm-elf-sid running the Dhrystone benchmark. Prior
to running the benchmark, some different options are given and the
differences in the generated SID configuration file are shown.
- This screen shot shows arm-elf-sid run with profiling enabled. The gprof component samples
the program counter at periodic intervals and writes an output file
suitable for processing by the gprof program. The results of
the profile are shown inside GNU Emacs.
- Finally, this screen shot shows a more complete SID configuration including:
- the Tk system manager listing instances of components in the
system.
- an xclock clone depicting the time inside the simulator's
real-time clock.
- a window showing the user-adjustable settings exported by the
gprof component.
- GDB about to connect to the simulator's gdb stub component and
step through the program.
$Id: index.html,v 1.1 2001/04/06 07:57:38 bje Exp $